
triageR provides a streamlined, reproducible workflow for building, validating, and reporting clinical prediction models in R. It combines standard machine learning and survival analysis tools with an optional AI agent that recommends appropriate statistical methods, runs automated sensitivity analyses, and flags common clinical modelling pitfalls. Reports are generated in a format aligned with TRIPOD+AI reporting guidance, to support reproducible, guideline-conscious research.
📖 Full documentation and function reference: https://devwebwacky.github.io/triageR/
Why triageR?
Most of the R machine learning tooling (tidymodels, mlr3, caret) is general-purpose. Clinical researchers are left to manually stitch together model fitting, validation, sensitivity analysis, explainability, and TRIPOD-compliant reporting across many separate packages. triageR brings these into one coherent workflow, with clinically-aware safeguards built in, such as warning when validation is performed only on training data, and flagging low events-per-variable ratios before you finalize a model.
The AI agent layer is entirely optional, every core function works without any LLM/API key. The agent adds method recommendations, plain language pipeline review summaries, and assists with sensitivity analysis interpretation, but is never required to fit, validate, or explain a model.
Installation
Install the released version from CRAN:
install.packages("triageR")Or the development version from GitHub:
# install.packages("devtools")
devtools::install_github("DevWebWacky/triageR")
Example workflow
This example uses the PIMA Indians Diabetes dataset to demonstrate the full triageR pipeline, from raw data to a validated, explainable model.
library(triageR)
library(MASS)

pima <- Pima.tr2
pima$id <- seq_len(nrow(pima))

pima_loaded <- tr_load_clinical(pima, id_col = "id")
pima_imputed <- suppressMessages(tr_impute(pima_loaded[, setdiff(names(pima_loaded), "id")],
                                            method = "mice", m = 5))
set.seed(42)
train_idx <- sample(seq_len(nrow(pima_imputed)), size = floor(0.7 * nrow(pima_imputed)))
train <- pima_imputed[train_idx, ]
test  <- pima_imputed[-train_idx, ]

model <- tr_fit(train, outcome = "type", engine = "logistic_reg")
#> Model fitted successfully using engine: logistic_reg
validation <- tr_validate(model, newdata = test)
#> Validation metrics (newdata):
#> # A tibble: 5 × 3
#>   .metric     .estimator .estimate
#>   <chr>       <chr>          <dbl>
#> 1 roc_auc     binary         0.873
#> 2 sens        binary         0.742
#> 3 spec        binary         0.797
#> 4 accuracy    binary         0.778
#> 5 brier_score binary         0.142
#>
#> Confusion Matrix:
#>           Truth
#> Prediction No Yes
#>        No  47   8
#>        Yes 12  23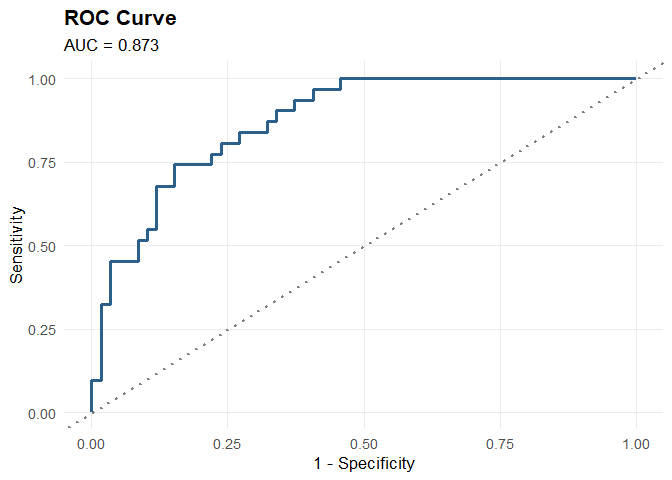
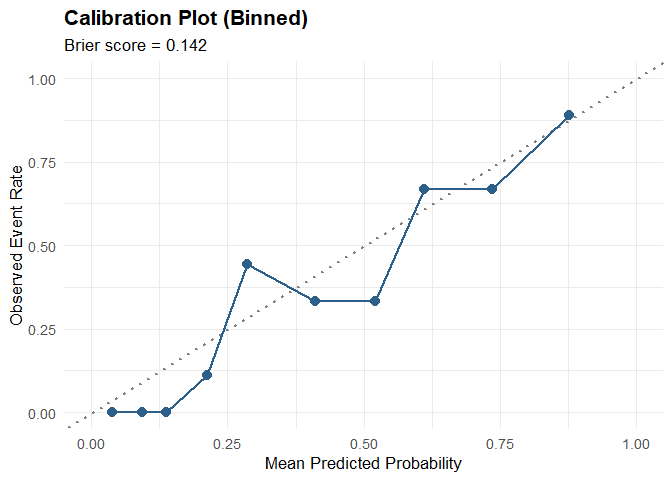
review <- tr_agent_review(train, model, use_agent = FALSE)
#>
#> --- triageR Pipeline Review ---
#>
#> No major issues flagged.
See vignette("triageR-intro") for the full walkthrough, including model explainability, sensitivity analysis, engine comparison (logistic regression vs. random forest vs. boosted trees), and TRIPOD+AI report generation.
Survival analysis
triageR also supports time-to-event outcomes via a parallel set of functions.
library(survival)

lung_clean <- lung
lung_clean$status <- lung_clean$status - 1
lung_clean <- lung_clean[stats::complete.cases(lung_clean), ]

model_surv <- tr_fit_survival(lung_clean, time_col = "time",
                               event_col = "status", engine = "cox_ph")
tr_validate_survival(model_surv, newdata = lung_clean)
See vignette("triageR-survival-analysis") for the full walkthrough.
Interactive app
For a no-code interface to the full triageR workflow, launch the built-in Shiny app:
This provides data upload, model fitting and comparison across engines, validation, explainability, automated pipeline review, and one-click TRIPOD+AI report generation.
Core functions
| Layer | Function | Purpose |
|---|---|---|
| Data | tr_load_clinical() |
Load and standardize clinical data |
| Data | tr_check_missing() |
Missingness summary and visualization |
| Data | tr_impute() |
Multiple imputation (mice / missForest) |
| Model | tr_fit() |
Fit a binary clinical prediction model |
| Model | tr_validate() |
Discrimination metrics, confusion matrix, ROC curve, and calibration |
| Model | tr_explain() |
Variable importance / SHAP explanations |
| Survival | tr_fit_survival() |
Fit Cox PH or Random Survival Forest models |
| Survival | tr_validate_survival() |
Concordance index (C-index) validation |
| Agent | tr_recommend_method() |
AI-suggested statistical/ML approach |
| Agent | tr_sensitivity() |
Automated sensitivity analysis battery |
| Agent | tr_agent_review() |
Pipeline pitfall checks (imbalance, EPV, leakage) |
| Report | tr_tripod_report() |
TRIPOD+AI-aligned HTML/docx report |
| App | tr_launch_app() |
Launch the interactive Shiny interface |
Disclaimer
triageR’s AI-generated recommendations and summaries are drafting aids intended to support, not replace, expert clinical and statistical judgment. The TRIPOD+AI report generator is a drafting tool and does not guarantee full compliance with the TRIPOD+AI checklist, always review against the official checklist at the EQUATOR Network.