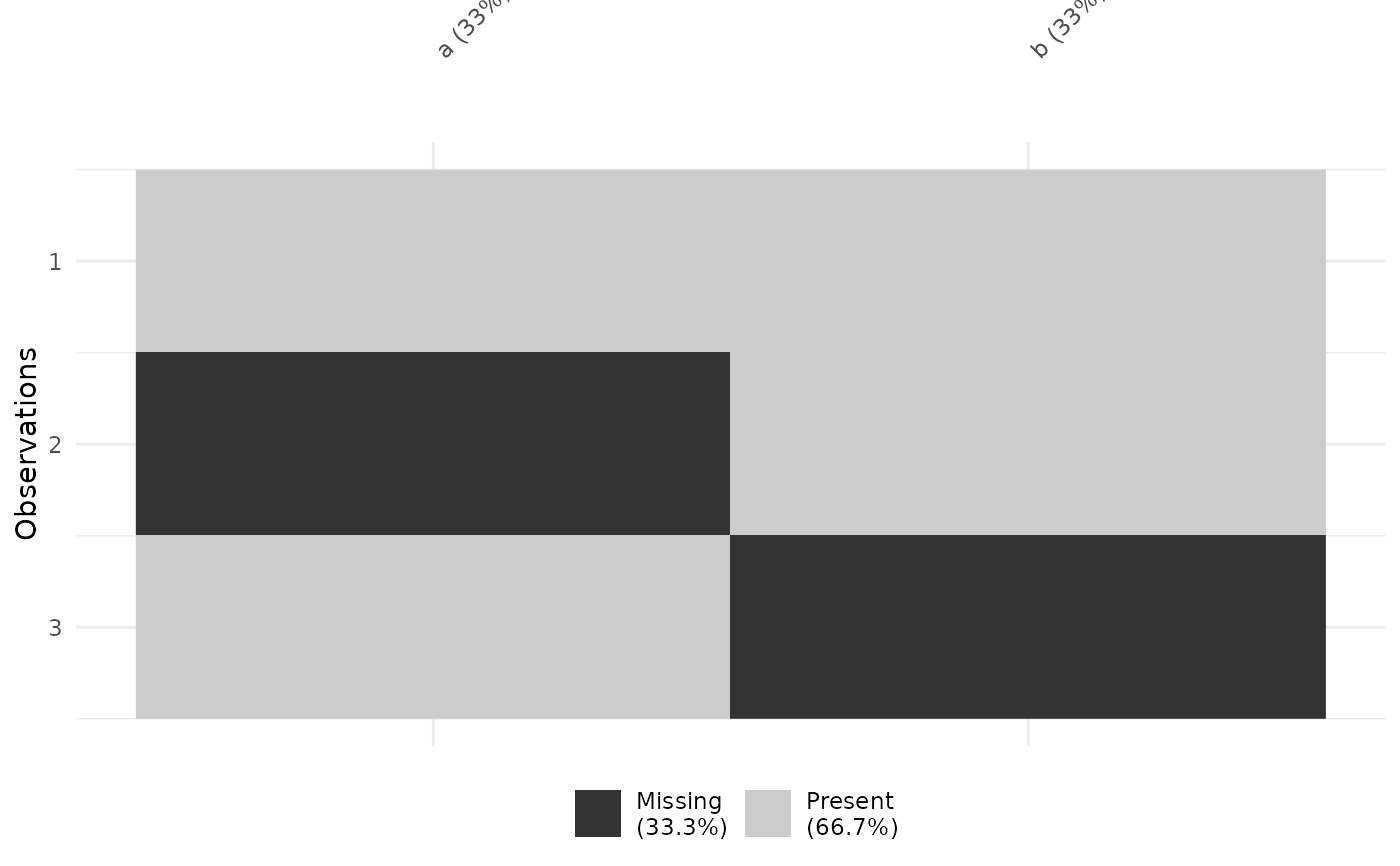
Produces a summary table of missingness per column, plus a visual plot showing the pattern of missing data across the dataset.
Arguments
- data
A data frame, typically the output of
tr_load_clinical().
Value
Invisibly returns a summary tibble (columns, n_missing, pct_missing). Also prints a summary to console and displays a missingness plot as a side effect.
Examples
df <- data.frame(a = c(1, NA, 3), b = c(4, 5, NA))
tr_check_missing(df)
#> Missing data summary:
#> - 2 of 2 columns have missing values
#> - 3 total rows
#> # A tibble: 2 × 3
#>   column n_missing pct_missing
#>   <chr>      <int>       <dbl>
#> 1 a              1        33.3
#> 2 b              1        33.3